What is Spectral Clustering Algorithm?
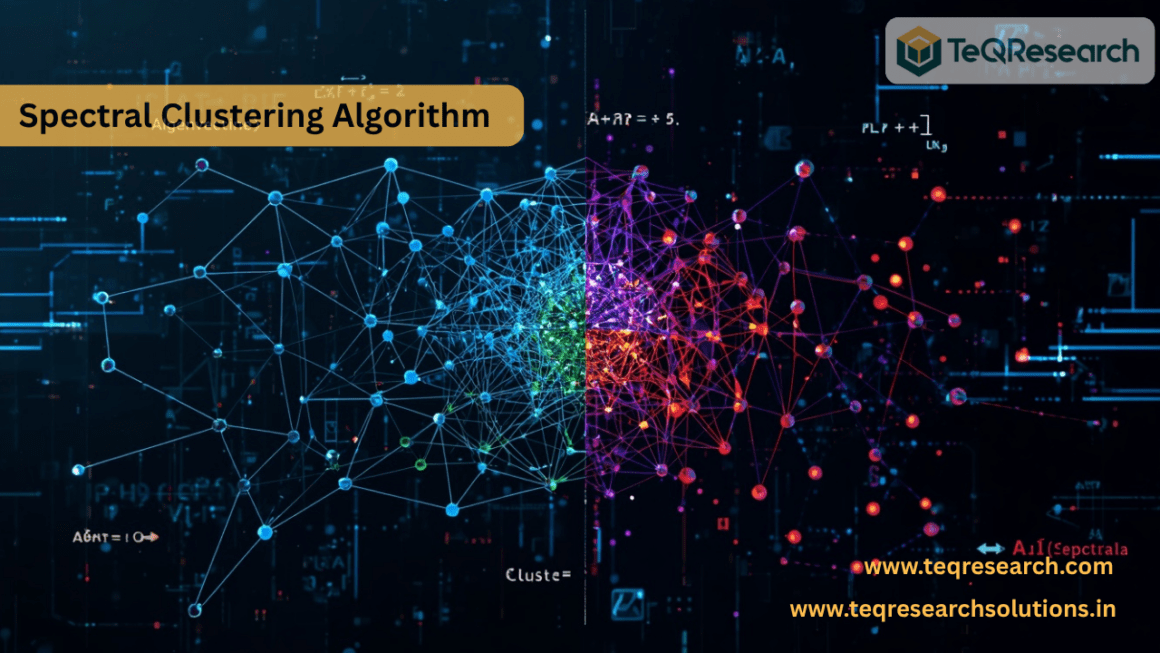
Spectral Clustering is an advanced unsupervised machine learning algorithm used to group similar data points into clusters based on the properties of a graph representation of the data. Unlike traditional clustering methods such as K-Means, which rely on geometric distances and assume spherical cluster structures, Spectral Clustering leverages concepts from graph theory, linear algebra, and eigenvalue decomposition to identify clusters of arbitrary shapes and complex structures. The algorithm transforms the original dataset into a graph where each data point is represented as a node, and the similarity between data points is represented as weighted edges. It then analyzes the eigenvalues and eigenvectors of a matrix derived from this graph, known as the graph Laplacian. By projecting data into a lower-dimensional spectral space, the algorithm reveals hidden cluster structures that may not be visible in the original feature space. Spectral Clustering is particularly effective when clusters are non-convex, intertwined, or connected through complex relationships. It has become a powerful tool in machine learning, computer vision, social network analysis, image segmentation, bioinformatics, and recommendation systems.
Introduction of Spectral Clustering Algorithm
Clustering is one of the most fundamental tasks in data mining and machine learning. The objective of clustering is to divide a dataset into groups such that data points within the same group are more similar to each other than to points in different groups. Traditional clustering techniques like K-Means work well when clusters are compact and spherical. However, real-world datasets often contain irregularly shaped clusters that cannot be effectively separated using conventional distance-based approaches.
To overcome these limitations, researchers introduced Spectral Clustering. The key idea behind Spectral Clustering is to represent data as a graph and use spectral properties of matrices associated with the graph to discover meaningful partitions. The term “spectral” originates from the study of eigenvalues and eigenvectors, collectively known as the spectrum of a matrix. Spectral Clustering utilizes these spectral properties to identify low-dimensional representations of the data that preserve important structural information.
The algorithm gained popularity due to its ability to:
- Detect arbitrarily shaped clusters
- Handle complex data distributions
- Work effectively with graph-based data
- Achieve high clustering accuracy
- Provide mathematically elegant solutions
Today, Spectral Clustering is widely regarded as one of the most powerful clustering techniques available in modern machine learning.
Detailed Spectral Clustering Algorithm
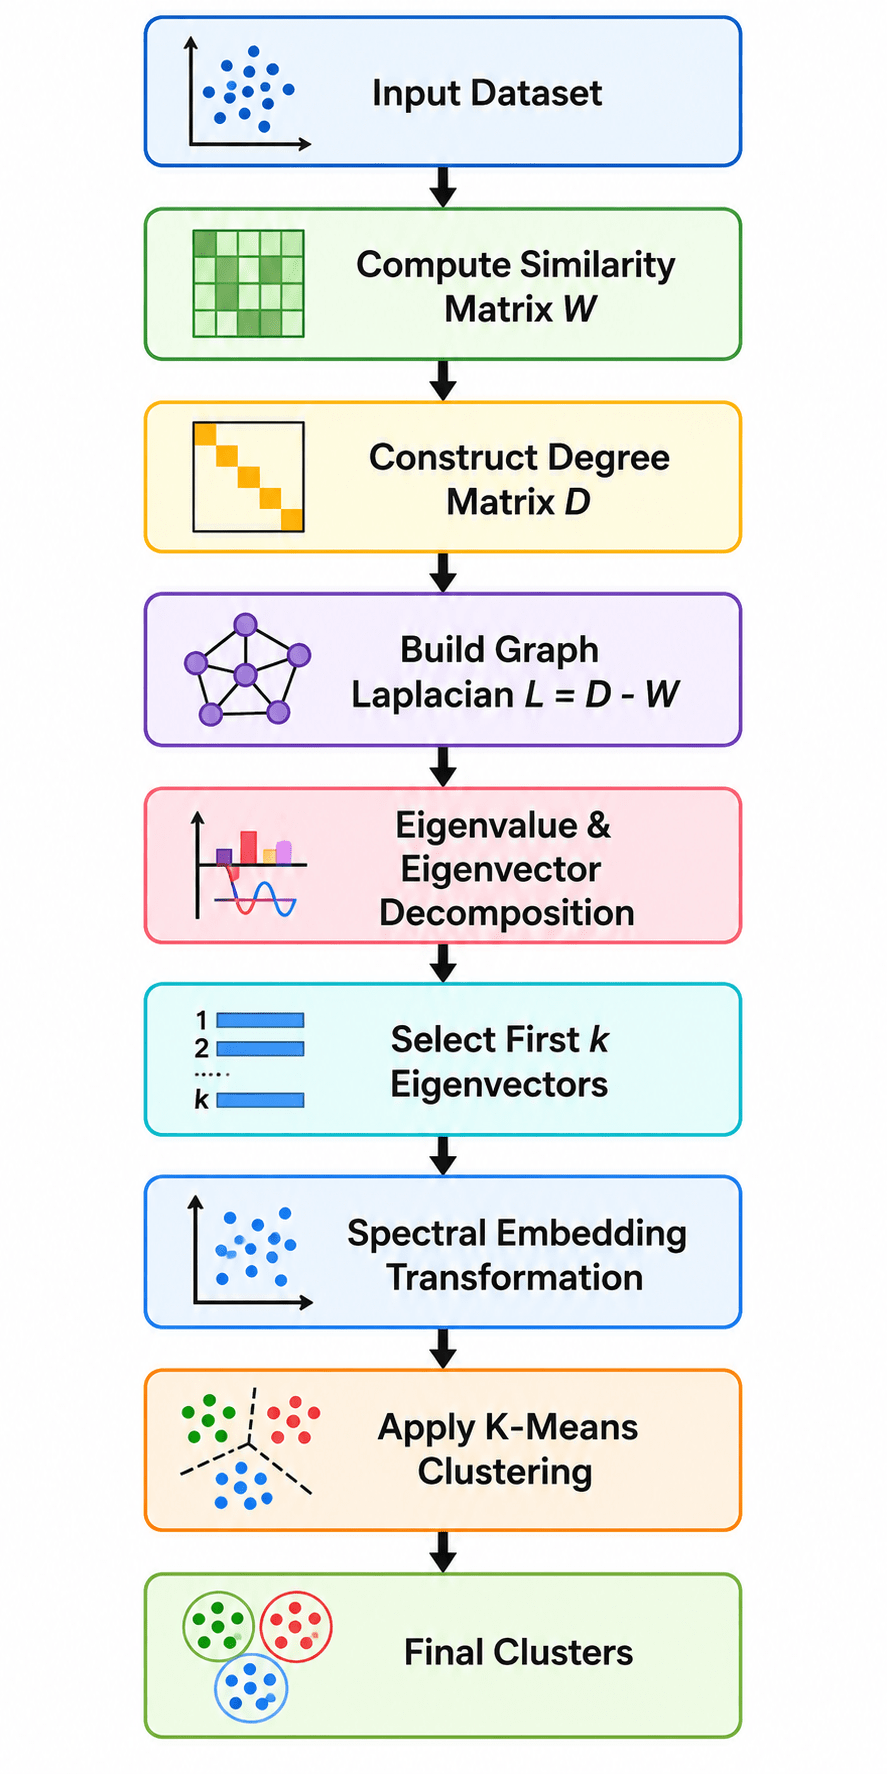
The Spectral Clustering algorithm consists of several mathematical steps involving graph construction, matrix formation, eigen decomposition, and clustering.
Step 1: Construct Similarity Matrix
Suppose we have a dataset:
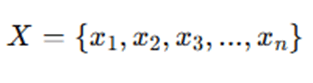
where:
- n = number of data points
- xi = ith data point
We first compute a similarity matrix W:

where:

A common similarity measure is the Gaussian Kernel:

where:
- ∣∣xi−xj∣= Euclidean distance
- Σ = scaling parameter
Step 2: Construct Degree Matrix
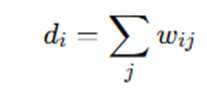
The Degree Matrix D is a diagonal matrix.
Each diagonal element is:

The degree matrix becomes:

where:
Step 3: Construct Graph Laplacian Matrix
The unnormalized Graph Laplacian is:
L=D−W
This matrix captures the structure of the graph.
Normalized Laplacian
In practice, normalized Laplacians are often preferred.
Symmetric Normalized Laplacian

Random Walk Laplacian

These normalized versions improve clustering performance when node degrees vary significantly.
Step 4: Compute Eigenvalues and Eigenvectors
Solve the eigenvalue problem:

where:
- L = Laplacian matrix
- v = eigenvector
- λ = eigenvalue
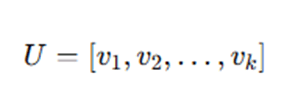
The algorithm selects the first k smallest eigenvalues and their corresponding eigenvectors.
Step 5: Form Spectral Embedding Matrix
Construct matrix U:
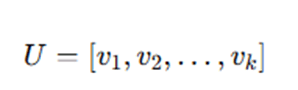
Each row corresponds to a transformed representation of a data point.

Step 6: Normalize Rows (Optional)
Normalize each row:
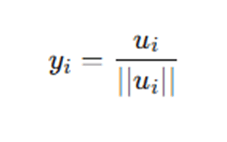
This step improves cluster separation.
Step 7: Apply K-Means Clustering
Run K-Means on rows of U or normalized rows Y.
Cluster(Y)
The resulting groups become the final clusters.
Step 8: Assign Original Data Points
Each transformed point corresponds to an original data point.
Cluster labels are transferred back to the original dataset.
Final output:
C1,C2,…,Ck
where Ci represents cluster i.
The Spectral Clustering process begins by converting the dataset into a graph structure. Every data point is treated as a node, and relationships between nodes are represented by weighted edges. The weight indicates how similar two data points are. Highly similar points receive large weights, while dissimilar points receive smaller weights. Once the graph is constructed, the algorithm creates a similarity matrix that contains pairwise similarity scores. This matrix serves as the foundation for understanding how data points relate to each other.
The next step involves computing the degree matrix. The degree matrix summarizes the total connectivity of each node by adding the weights of all edges connected to that node. It provides a measure of how strongly each data point is connected to the rest of the graph.
Using the similarity matrix and degree matrix, the algorithm constructs the graph Laplacian. The Laplacian captures the connectivity structure of the graph and is central to spectral graph theory. It contains valuable information about cluster boundaries and graph partitions.
The algorithm then performs eigenvalue decomposition on the Laplacian matrix. This mathematical operation extracts eigenvalues and eigenvectors that reveal important structural properties of the graph. The smallest eigenvalues and their corresponding eigenvectors are particularly useful because they encode information about potential cluster divisions. These selected eigenvectors are combined into a new matrix called the spectral embedding matrix. In this transformed space, data points that belong to the same cluster become more closely grouped together, even if they were difficult to separate in the original feature space.
After obtaining the spectral embedding, the algorithm may normalize the rows to improve stability and cluster separation. Each row now represents a data point in the new spectral space. A traditional clustering algorithm, usually K-Means, is then applied to the transformed data. Because the spectral transformation has simplified the cluster structure, K-Means can now effectively identify the groups.
Finally, cluster labels are mapped back to the original dataset. The result is a set of clusters that accurately capture the underlying structure of the data, even when clusters have complex shapes or non-linear boundaries. This combination of graph theory, matrix algebra, and clustering makes Spectral Clustering one of the most powerful techniques for unsupervised learning.
Example of How Spectral Clustering Algorithm Works
Consider the following dataset:
Cluster A
Points:
- (1,1)
- (1.5,1)
- (2,1)
Cluster B
Points:
- (8,8)
- (8.5,8)
- (9,8)
Cluster C
Points:
- (5,12)
- (5.5,12)
- (6,12)
The algorithm proceeds as follows:
Step 1
Compute pairwise similarities between all points.
Step 2
Create similarity matrix.
| Point | P1 | P2 | P3 |
| P1 | 1.0 | 0.95 | 0.90 |
| P2 | 0.95 | 1.0 | 0.94 |
| P3 | 0.90 | 0.94 | 1.0 |
Similar values are computed for all points.
Step 3
Create graph representation.
Nearby points receive strong connections.
Distant points receive weak connections.
Step 4
Construct degree matrix and Laplacian matrix.
Step 5
Perform eigen decomposition.
Step 6
Select first three eigenvectors.
Step 7
Map points into spectral space.
Step 8
Run K-Means with:
k=3k=3k=3
The algorithm successfully identifies:
- Cluster A
- Cluster B
- Cluster C
Even if clusters have irregular shapes, Spectral Clustering can still separate them effectively.
Advantages and Disadvantages of Spectral Clustering Algorithm
Advantages :
- Handles Complex Cluster Shapes: Spectral Clustering can identify irregular, non-convex, and arbitrarily shaped clusters that traditional algorithms like K-Means often fail to detect.
- Graph-Based Approach: The algorithm represents data as a graph, making it highly effective for analyzing network-based and relationship-driven datasets.
- High Accuracy: It often produces more accurate clustering results than traditional clustering methods, especially for complex datasets.
- Effective for Non-Linear Boundaries: Spectral Clustering can separate clusters with complex non-linear boundaries that are difficult to identify using distance-based methods.
- Strong Mathematical Foundation: The algorithm is based on graph theory, eigenvalue decomposition, and linear algebra, providing a solid theoretical framework.
- Flexible Similarity Measures: It supports various similarity functions, including Gaussian kernels, nearest-neighbor graphs, and customized similarity metrics.
- Good for Image Segmentation: Spectral Clustering is widely used in computer vision and image processing for dividing images into meaningful regions.
- Works with Sparse Data: The graph-based structure allows the algorithm to effectively handle sparse datasets and sparse network connections.
Disadvantages :
- Computationally Expensive: The eigenvalue decomposition process requires significant computational resources, particularly for large datasets.
- Memory Intensive: The algorithm must store similarity matrices, which can consume large amounts of memory as the dataset grows.
- Scalability Issues: Its performance and efficiency decrease when handling very large datasets due to increased computational complexity.
- Parameter Selection Challenges: The algorithm requires careful tuning of parameters such as the number of clusters (k), similarity function, and sigma value to achieve optimal results.
- Sensitive to Graph Construction: The quality of clustering depends heavily on how the similarity graph is constructed. Poor graph design can lead to inaccurate clusters.
- Complex Eigenvector Computation: Calculating eigenvectors for large matrices can be mathematically intensive and time-consuming.
- Not Suitable for Streaming Data: Spectral Clustering is generally designed for static datasets and is not well-suited for continuously changing or streaming data.
- Difficult Interpretation: The transformed spectral space and eigenvector-based representation can be harder to interpret compared to traditional clustering methods.
Applications of Spectral Clustering Algorithm
Spectral Clustering has been successfully applied across many domains.
- Computer Vision: In computer vision applications, Spectral Clustering helps identify patterns, structures, and objects within visual data. It is commonly used for face recognition, object tracking, scene understanding, and image classification, where complex visual relationships need to be analyzed effectively.
- Image Segmentation: Spectral Clustering is widely used in image segmentation to divide an image into meaningful regions based on pixel similarity. By analyzing relationships between neighboring pixels, it can accurately identify objects and boundaries within images, making it valuable in medical imaging, satellite image analysis, and object recognition systems.
- Social Network Analysis: Spectral Clustering is used to detect communities and groups within social networks by analyzing relationships among users. It helps identify closely connected communities, influential users, and interaction patterns, supporting applications such as friend recommendations and social behavior analysis.
- Bioinformatics: In bioinformatics, Spectral Clustering assists in analyzing complex biological datasets. It is commonly applied to gene expression analysis, protein interaction networks, DNA sequence classification, and disease pattern identification, helping researchers uncover meaningful biological relationships.
- Recommendation Systems: Spectral Clustering enhances recommendation systems by grouping users and items with similar characteristics. It is widely used in e-commerce, streaming platforms, and online services to provide personalized recommendations based on user preferences and behavioral patterns.
- Market Segmentation: Businesses use Spectral Clustering to segment customers into distinct groups according to purchasing behavior, demographics, and preferences. This enables organizations to develop targeted marketing campaigns, improve customer engagement, and increase sales effectiveness.
- Telecommunications: In the telecommunications industry, Spectral Clustering helps analyze network traffic patterns and communication structures. It is used for network optimization, resource allocation, traffic management, and identifying usage patterns to improve service quality and operational efficiency.
- Cybersecurity: Spectral Clustering plays an important role in cybersecurity by identifying unusual network behaviors and suspicious activities. It is used for intrusion detection, malware analysis, fraud detection, and anomaly detection, helping organizations strengthen their security infrastructure.
- Natural Language Processing (NLP): In NLP, Spectral Clustering is applied to group similar documents, words, or text segments. It supports applications such as document classification, topic modeling, sentiment analysis, text mining, and information retrieval by uncovering semantic relationships within textual data.
- Financial Analytics: Financial institutions use Spectral Clustering to analyze large volumes of financial data and identify hidden patterns. Applications include risk assessment, customer segmentation, portfolio optimization, stock market analysis, and fraud detection, supporting better financial decision-making.
- Transportation Systems: Spectral Clustering is used in transportation and logistics to analyze traffic flow, mobility patterns, and route networks. It helps optimize route planning, reduce congestion, improve traffic management, and support smart transportation systems in modern cities.
- Healthcare Analytics: In healthcare, Spectral Clustering assists in grouping patients with similar medical conditions, symptoms, or treatment responses. It is used for disease classification, patient segmentation, healthcare resource planning, and medical research, enabling more effective and personalized healthcare services.
Conclusion
Spectral Clustering is a sophisticated and highly effective clustering algorithm that combines graph theory, linear algebra, and machine learning principles to uncover hidden structures within complex datasets. Unlike traditional clustering methods that rely solely on geometric distances, Spectral Clustering leverages similarity graphs and eigenvalue decomposition to identify clusters with arbitrary shapes and non-linear boundaries.
The algorithm operates by constructing a similarity graph, computing the graph Laplacian, performing eigen decomposition, and transforming data into a lower-dimensional spectral space where clustering becomes significantly easier. This unique approach enables Spectral Clustering to outperform conventional methods in many challenging scenarios, particularly when dealing with irregular cluster structures, network data, and high-dimensional datasets.
Although computational complexity and scalability remain challenges for very large datasets, the algorithm’s strong theoretical foundation and exceptional clustering capabilities have made it a preferred choice in fields such as computer vision, bioinformatics, social network analysis, cybersecurity, healthcare, and recommendation systems. As machine learning and data analytics continue to evolve, Spectral Clustering remains an essential technique for discovering meaningful patterns and structures in complex data environments.
Frequently Asked Questions (FAQs)
Q 1: What is Spectral Clustering used for?
Spectral Clustering is used to group similar data points into clusters, especially when clusters have complex, non-spherical, or non-linear shapes that traditional algorithms struggle to identify.
Q 2: How is Spectral Clustering different from K-Means?
K-Means relies on Euclidean distance and assumes spherical clusters, while Spectral Clustering uses graph-based similarity relationships and eigenvector analysis, allowing it to detect more complex cluster structures.
Q 3: Why is the graph Laplacian important in Spectral Clustering?
The graph Laplacian captures the connectivity structure of the similarity graph and helps reveal natural cluster boundaries through its eigenvalues and eigenvectors.
Q 4: What are eigenvectors used for in Spectral Clustering?
Eigenvectors provide a lower-dimensional representation of the data that preserves important structural information, making clusters easier to separate and identify.
Q 5: What are the major limitations of Spectral Clustering?
The primary limitations include high computational cost, memory requirements, scalability challenges for large datasets, and sensitivity to parameter selection and graph construction methods.